August 2010 Archives

Part 4: Downloading Model Content

| No Comments | No TrackBacks

This is part of the tutorial series Using ModelView

First be sure to select the model you are interested in. In the Model Overview section, at the far right are several links for downloading model content.

Download Links

SBML, or Systems Biology Markup Language, is a standardized XML document for representing models. Model SEED Format is a semicolon delimitated table of model data that you can import into a spreadsheet program. LP Format is the Linear Programming optimization file that is used for performing flux balance analysis.

Continue on to Part 5: Running Flux-Balance Analysis on Models

This is part of the tutorial series Using ModelView

Select one or more models

Select one or more models. Then, from the "Selected Models/FBA" tab, click the "Run FBA" bar to open the flux panel.

Flux Bar Closed

Select media condition

Now, select a media condition on which to run the flux balance analysis: begin typing in the media condition name (#1) until yours is selected or select it from the drop down list. Then click "Run" (#2).

Flux Bar Open

Saved fluxes table

Clicking the "Run" button above will take you to the "Flux Balance Results" tab (#1). From here, you can see basic information about your saved fluxes: the date it was ran on, model ID, method media name and final biomass flux (#2). From here, you can check the select-box next to specific runs you would like to see in more detail (#3) and click "View selected results". You can also delete results by checking the box and clicking "Delete selected results".

Saved Fluxes

View Flux Details

Clicking the "View selected results" button will switch to the "Reaction tab", which may take some time to load.

Loading Fluxes

Once the "Reaction" tab (#1) has loaded, you will see the flux results in tabs titled "Flux #1", "Flux #2", etc. for the fluxes you selected (#2). You can add or remove columns from the table by clicking the "..." header.

Flux Information

This is part of the tutorial series Using ModelView.

General Info

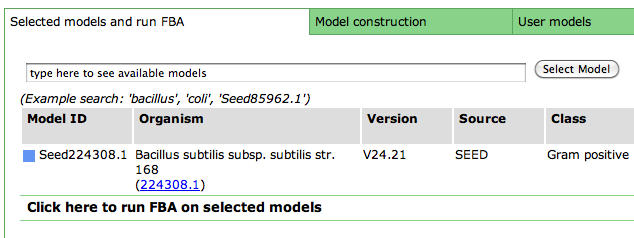
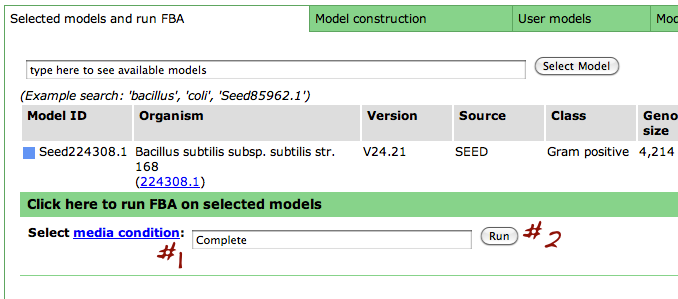
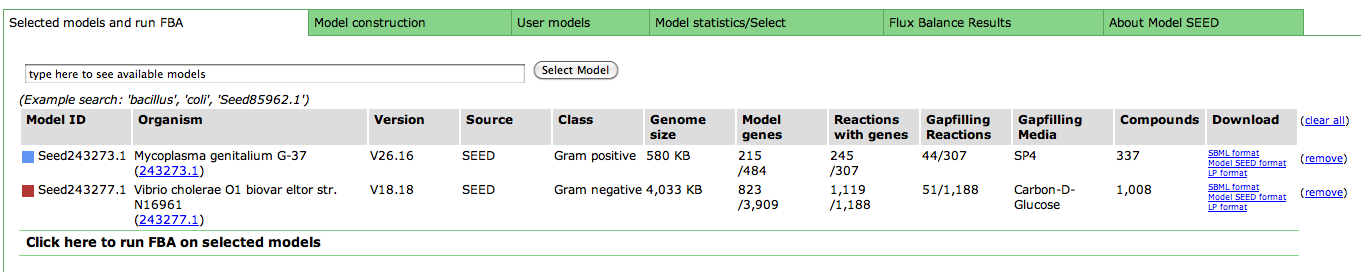
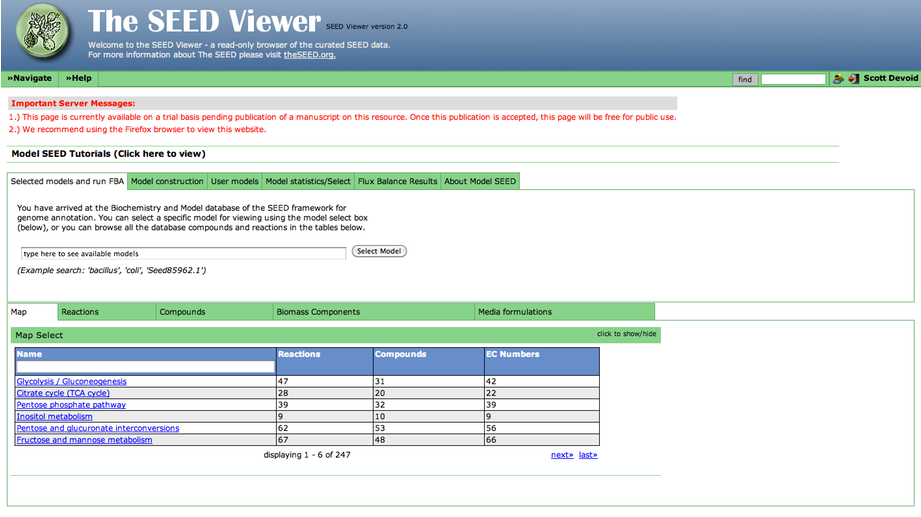
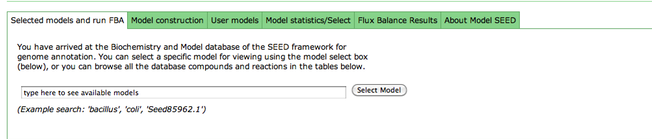
After you have selected a model, you can use the tools within the Model SEED to examine the information for that model. The tools organize the data associated with the model into maps and tables that make it easy for the user to search or browse for relevant information.

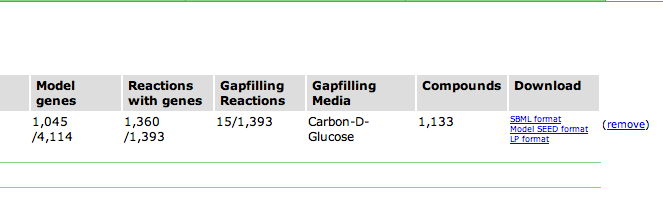
Upon selecting the model, you are greeted with an overview page. This contains information about the organism and the model. You can download the complete model in differnet formats (SBML, Model SEED, and LP), and deselect this model from this page as well.

General Model Info

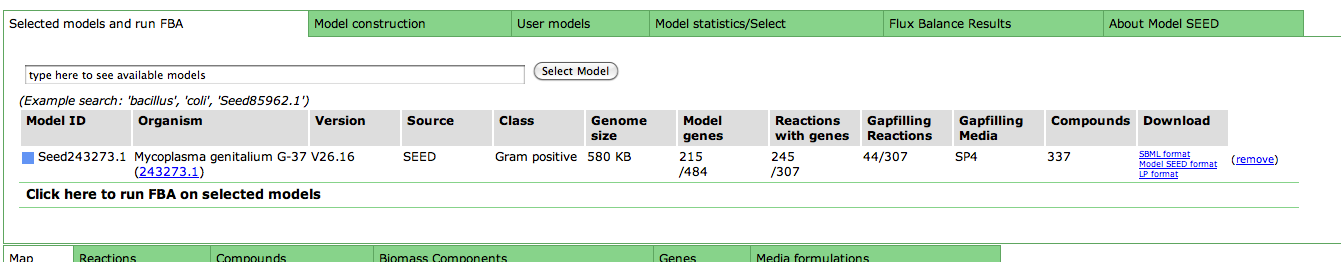
Underneath the first set of tabs is another tabbed interface which contains the model information.

KEGG Maps

Maps Tab

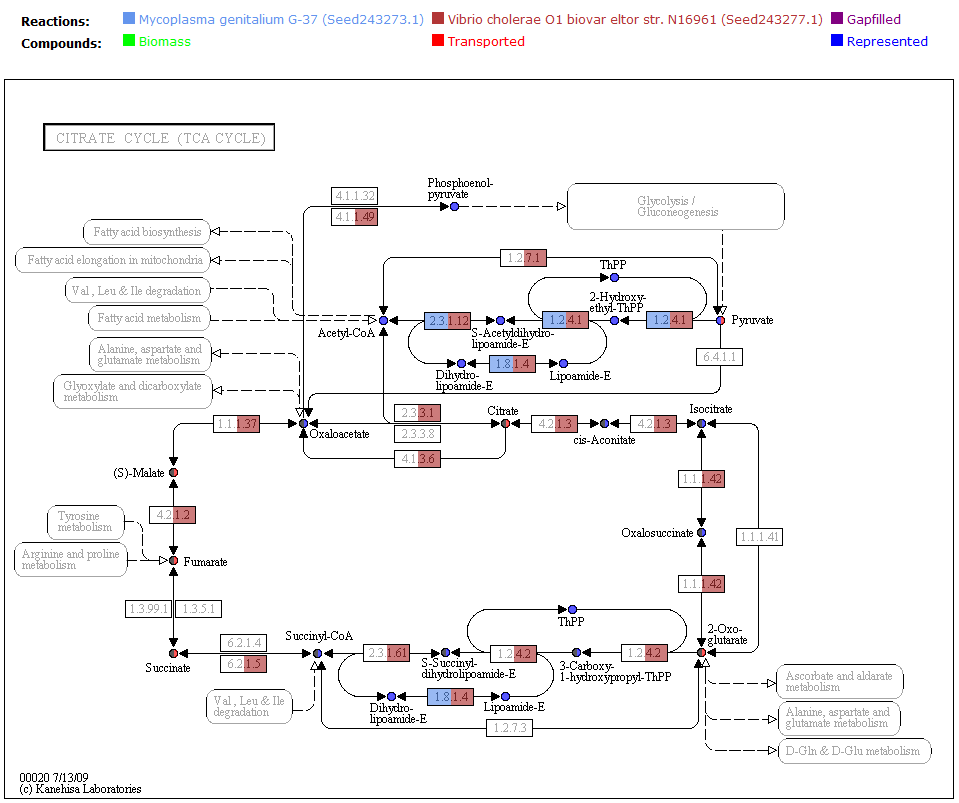
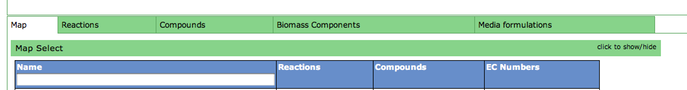
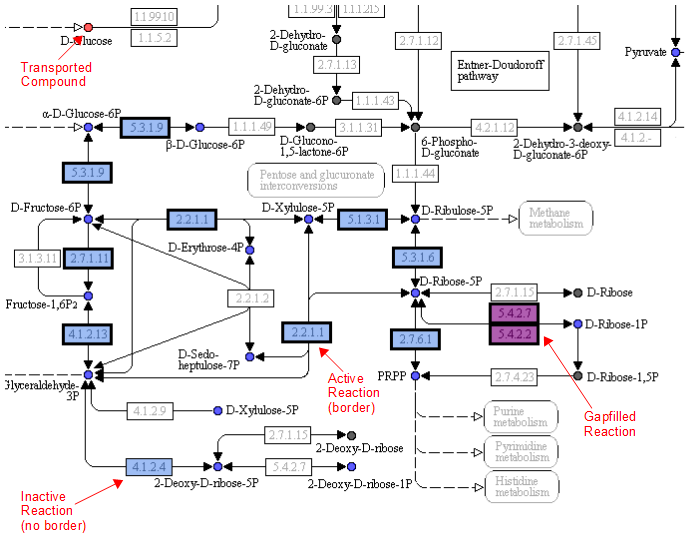
One way the data is organized is by KEGG pathways. The model information is overlaid onto the KEGG maps with a color scheme to determine the state of the compounds and reactions.

To see a list of all the available maps, click the "Map Select" bar.

Map Select

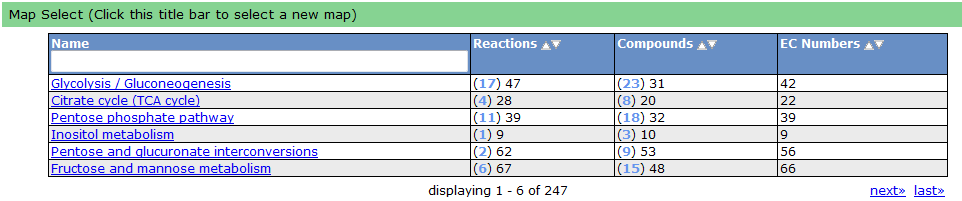
Clicking on one of the links causes the new map to show up in place of the current map.

A legend tells the user how to interpret the colors. The compounds (circles) can have the following attributes: Transported, Represented, or Biomass. If the compound is gray, then it is not in the model. The reactions (rectangle) are colored according to the organism that is currently selected. If a reaction appears purple, then it is gapfilled.

Annotated KEGG Map

Reaction Tab

Reaction Tab

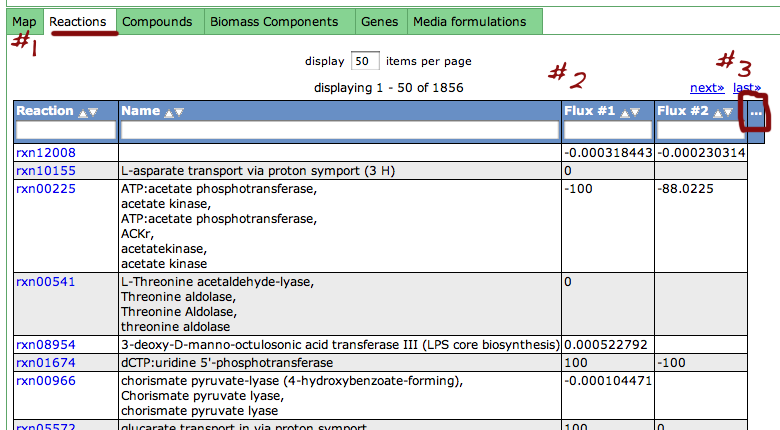
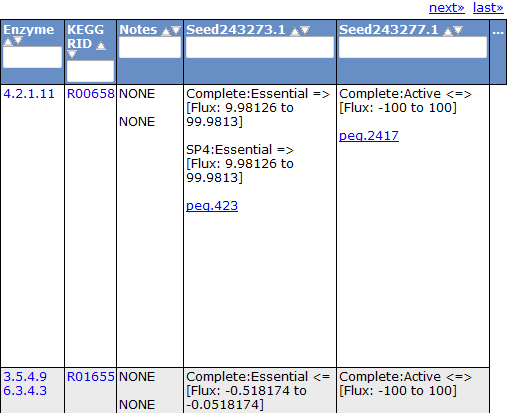
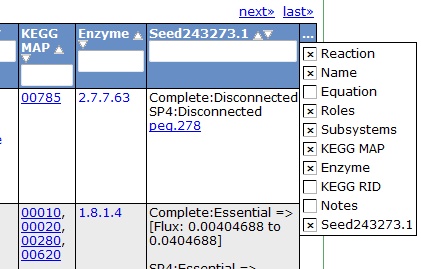
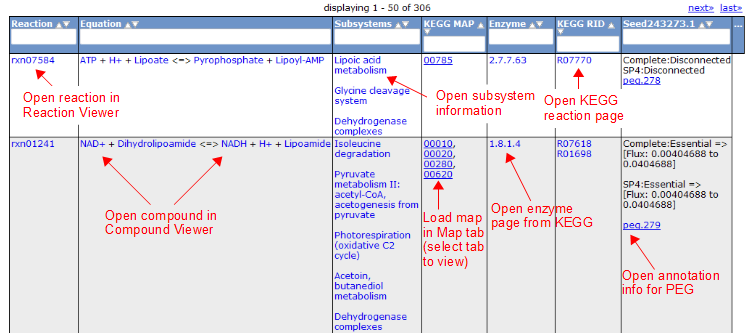
To view all the reactions in the model, click on the 'Reactions' tab. This brings up a table containing each reaction and some general information. The table contains the following columns:

Reaction Table Header

This table can be searched and sorted via the column headers. Also, you can hide columns by clicking on the '...' in the last column and unselecting column names.

Reaction Table Header Select

Here is an overview of the links inside the reaction table.

Reaction Table Details

Compound Tab

Compound Tab

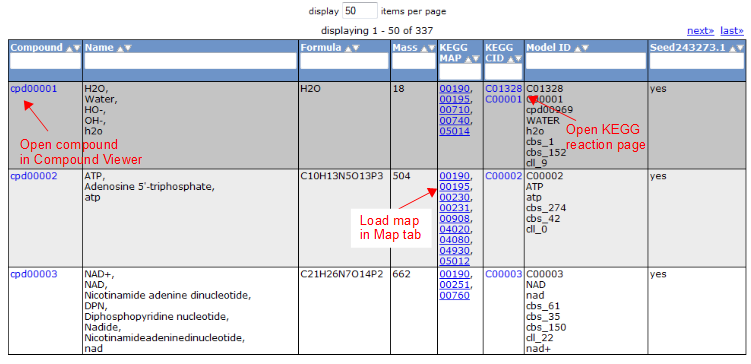
To view all the compounds in the model, click on the 'Compounds' tab. This tab contains a table with additional information about each compound.

Compound Table

Gene Tab

Gene Tab

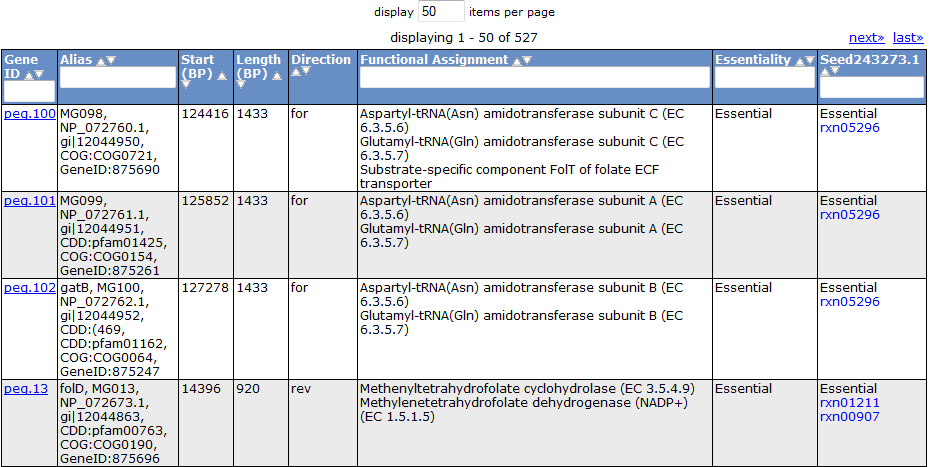
Selecting the 'Gene' tab brings up a table containing all the genes in the model. This table shows information about the gene, such as the peg annotation, the functional assignment, and the essentiality.

Gene Table

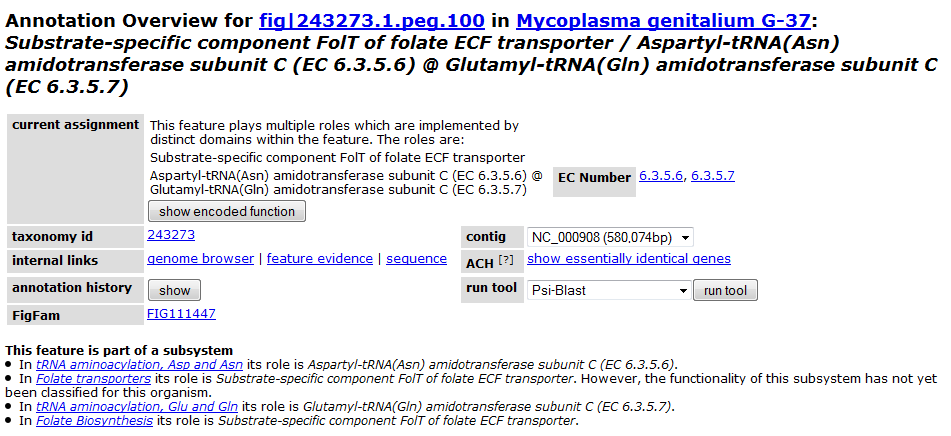
Clicking on one of the peg links opens a new page devoted to that peg annotation in the currently selected organism. For example, the below image was for 'peg.100' in the table above. This is just a sample of some of the information shown on this page.

Annotation Example

Continue on to Part 3: Comparing Two or More Models

This is part of the tutorial series Using ModelView

In order to compare models, you must first select two or more models to begin comparison. If you are already viewing a model and select a new model, the two models will show up side-by-side. To do this, simply click on any model link that can be found throughout the Model SEED page, either in the 'Selected Models/FBA' tab, the 'Model Statistics/Select' tab, or the 'User models' tab.

Once you have selected multiple models, you will be greeted with a broad overview of the models.

Selected Models

Viewing the Maps

The KEGG maps are used to help compare models by overlaying different colors according to the status of the reactions and compounds in each model. This allows you to quickly see which reactions and compounds belong to both models, and which do not. The legend tells you the color scheme so you can see which model is what color.

KEGG Maps

Comparing Reactions

To futher view the differences between models, you can compare the reactions by clicking on the 'Reactions' tab. The right columns of the table show the status of each reaction for the currently selected models.

Reaction Table

A similar comparison feature can be found in the compound tab, biomass tab, and gene tab.

Continue on to Part 4: Downloading Model Content

Using ModelView - Introduction

| No Comments | No TrackBacks

ModelView is the primary tool for viewing, comparing and testing models. In this tutorial series, we will show you how to use ModelView to explore your models. If you would like to know more about our methodology and terminology see the methodology section of our tutorials.


Tutorial Contents


Introduction

Note: we recommend that you use the Firefox browser.

Ok, if you visit the model viewer page now, you'll get a page like this:

Overview of ModelView

Beneath the important server messages is a series of overview tabs labeled "Select models and run FBA", "Model Construction", "User Models", etc. Clicking on a tab will reveal it's content.

Closeup of First Tab

In addition, beneath this section is another set of tabs providing various views into the model data. This includes "Map" which contains KEGG maps annotated with model data, and "Reactions" and "Compounds" which contain details about the reactions and compounds present in the model.

Closeup of Second Tab

Continue to Part 1: Selecting a Model.

This is part of the tutorial series Using ModelView.

ModelView is the main tool for viewing, comparing, editing and testing your models. There are a number of different ways to select a model for viewing:

  1. Private RAST annotated genome: If you uploaded your genome to the RAST Annotation Server, select the genome from the list of completed jobs and select "view model". This wil open the ModelView page with your model selected. Alternatively, you can open ModelView and click the "User Models" tab. From here select your private model from the table.
  2. Publicly available models: We provide hundreds of publicly available models---both Model SEED generated models and models from the literature. If you know what model or organism you are looking for, type it into the box under the "Selected models and FBA". Otherwise, you can see all publicly available models under the "Model statistics/select" tab.

Continue on to Part 2: Viewing Model Details.

What is a biomass reaction?

| No Comments | No TrackBacks
In metabolic models, biomass reactions are included to enable the simulation of cell growth and division via the simultaneous production of all small molecule building blocks of biomass (e.g. amino acids, lipids, nucleotides, and cofactors); the product of the biomass reaction is one gram of biomass, while the reactants are the constituent metabolites that combine to form one gram of biomass.

What is a model?

| No Comments | No TrackBacks
When we say that we now support generation, maintenance, and use of
"metabolic models", what do we mean?  There are a number of possible
meanings of such a term, and many of them are used in different
contexts.

For our purposes a metabolic model is three things:
  1. the biomass reaction, which is a list of small compounds, co-factors, nucleotides, amino acids, and cell wall components needed to support growth.  We think of this as the list of "required parts".
  2. a list of the compounds that can be transported into and out of the cell
  3. the reaction network that the cell uses to maintain its existence.  This reaction network is encoded as a stoichiometric matrix.
We have defined a precise encoding of models, so we can import and export them, as well as updating them to reflect constantly improving estimates of the roles of specific genes and knowledge of phenotype.

What is metabolic flux balance analysis?

| No Comments | No TrackBacks

Wikipedia describes flux-balance analysis as follows:

Flux Balance Analysis (FBA) is a mathematical method for analyzing metabolism. It does not require knowledge of metabolite concentration or details of the enzyme kinetics of the system. The assumption is made that the system being studied is homeostatic and the technique then aims to answer the question: given some known available nutrients, which set of metabolic fluxes maximizes the growth rate of an organism whilst preserving the internal concentration of metabolites?

We use flux-balance analysis for a number of purposes, but let us focus on just two key uses:

  1. You can use FBA technology to predict which genes are essential under specific growth media.

  2. You can predict which substrates the organism will be able to support growth. Specifically, we should, if our model is accurate, be able to predict growth under the conditions represented by Boiolog plates

That is, we construct an initial model of the reaction network from annotations, and then we "run" this model to make predictions (using FBA). When the predictions fail to match the reality, we must track down the causes of the discrepancies, update the model, and try again. This process has been used to rapidly identify incorrect annotations, and iteratively improve the annotations/models to achieve a consistent set of predictions.

About this Archive

This page is an archive of entries from August 2010 listed from newest to oldest.

September 2010 is the next archive.

Find recent content on the main index or look in the archives to find all content.

Categories

Pages